What is Interval Scale? Definition, Examples & Uses in Surveys
Published Date: Dec 26, 2025

Key Takeaways
Interval scales measure equal distances between values - The difference between 30 and 40 is exactly the same as between 60 and 70, enabling meaningful mathematical comparisons.
Zero is arbitrary, not absolute - On interval scales, zero doesn't mean none or absence, which is why you can't make ratio statements like 80°F is twice as hot as 40°F.
Common in surveys and research - Likert scales, NPS, satisfaction ratings, IQ scores, and temperature all use interval measurement.
Enable powerful statistical analysis - You can calculate averages, standard deviations, and correlations with interval data, unlike nominal or ordinal scales.
Use 5-7 point scales for best results - Consistent scaling, clear labels, and centered midpoints improve response quality and data reliability in surveys.
The scales you choose shape the insights you get. When you ask respondents to rate satisfaction from 1 to 5 or measure their likelihood to recommend, you're using an interval scale, and it's one of the most useful tools for survey analysis.
What is the interval scale?
The interval scale is a quantitative measurement scale that captures not just the order of data, but also the meaningful, equal distances between values. Unlike simpler scales, interval scales allow you to measure how far apart data points are from each other, and those distances are always the same.
Think of it this way, on an interval scale, the difference between 30 and 40 is exactly the same as the difference between 60 and 70. This consistency is what makes interval scales so powerful for analysis.
Here's the catch that trips up many researchers, interval scales have an arbitrary zero point. Zero doesn't mean none or absence. On a Celsius thermometer, 0°C doesn't mean there's no temperature, it's just a point on the scale. This distinction matters when deciding which scale to use.
The interval scale is the third level of measurement, sitting between ordinal scales, which only show order and ratio scales, which have a true zero point. For anyone designing surveys, collecting feedback, or analyzing quantitative data, understanding when and how to use interval scales is essential.
How interval scales compare to other measurement scales
To fully understand interval scales, it helps to see how they stack up against the other three primary measurement scales. Here's a breakdown:
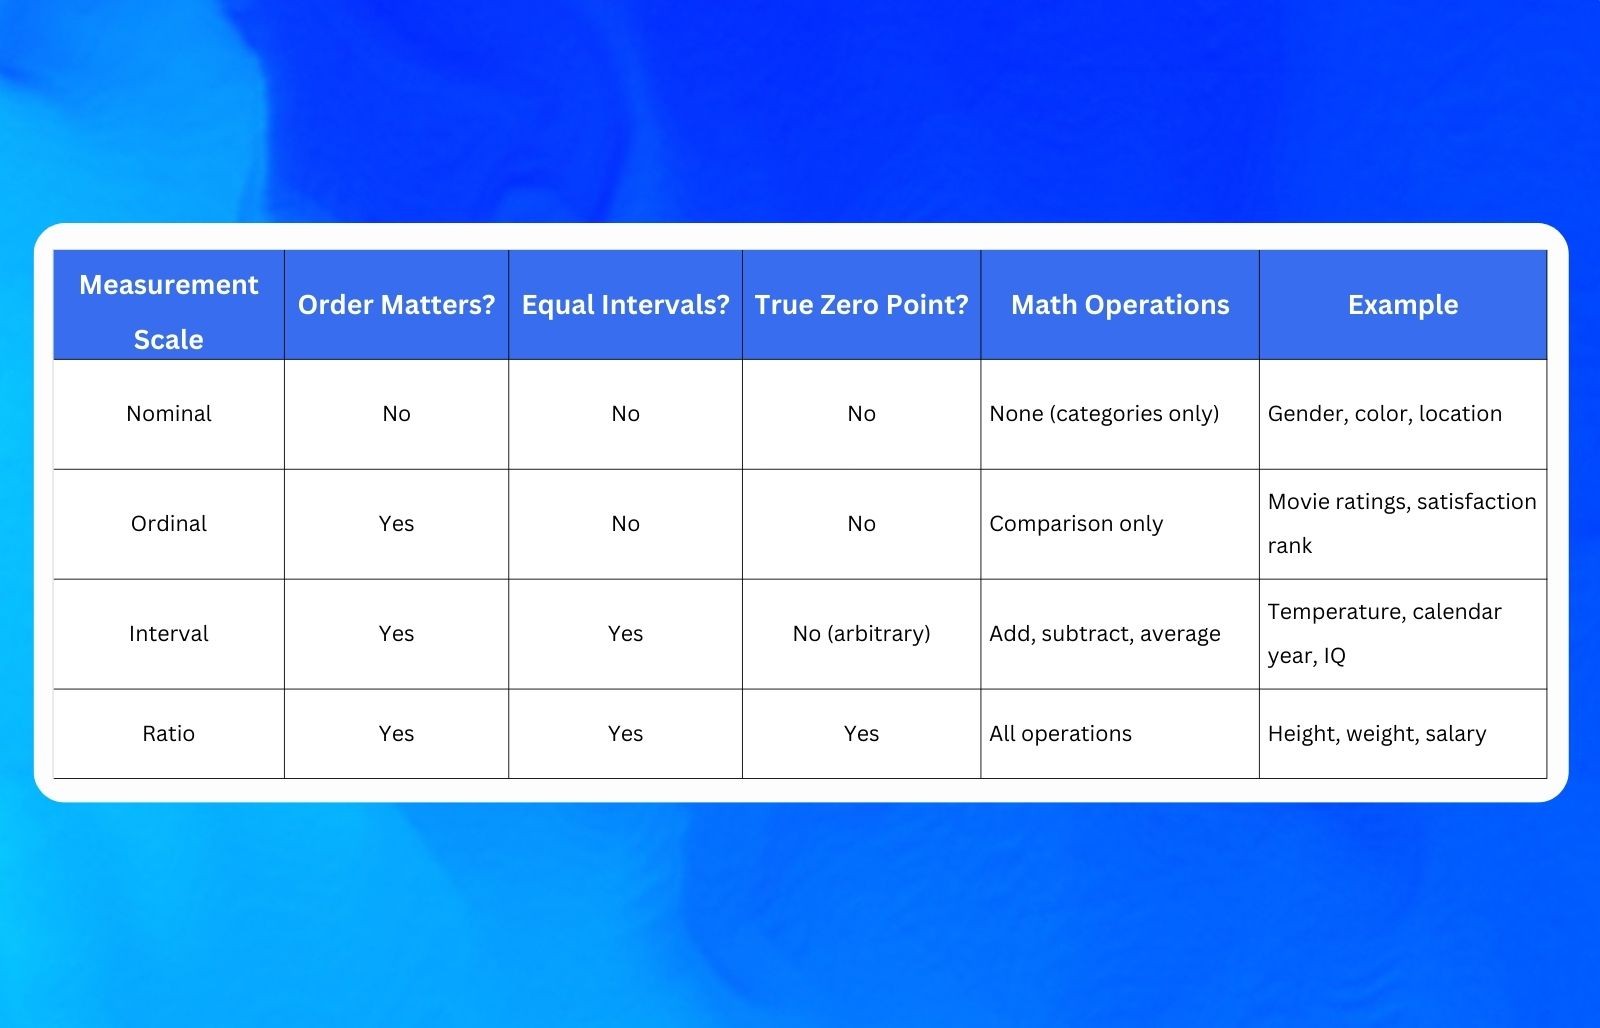
Nominal scale
The most basic level of measurement. Nominal scales categorize data into distinct groups with no inherent order, think gender, color, or survey response types like Yes/No. You can count frequencies, but you can't rank or measure distances between categories.
Ordinal scale
A step up from nominal. Ordinal scales rank data in order (first place, second place, third place), but the distances between ranks aren't equal. In a customer satisfaction survey asking Poor, Fair, Good, Excellent, you know Good is better than Fair, but you can't say how much better. The gaps between rankings vary.
Interval scale
Here's where measurement gets precise. Interval scales maintain order like ordinal scales, but they add equal distances between each point. The difference between 3 and 4 is exactly the same as between 7 and 8. This consistency lets you perform mathematical operations, add, subtract, and calculate averages. The catch? Zero is arbitrary, not absolute.
Ratio scale
The most sophisticated measurement level. Ratio scales have everything interval scales offer, plus a true zero point that means complete absence. Weight, height, and age are ratio scales. Because zero is absolute, you can make statements like 10kg is twice as heavy as 5kg. You can't do that with interval data.
Ordinal scales let you rank things, but interval scales let you measure the actual distance between rankings. That's the upgrade that makes interval scales so useful for quantitative research and survey analysis.
Key characteristics of interval scales
Interval scales share five defining characteristics that shape how you can use them:
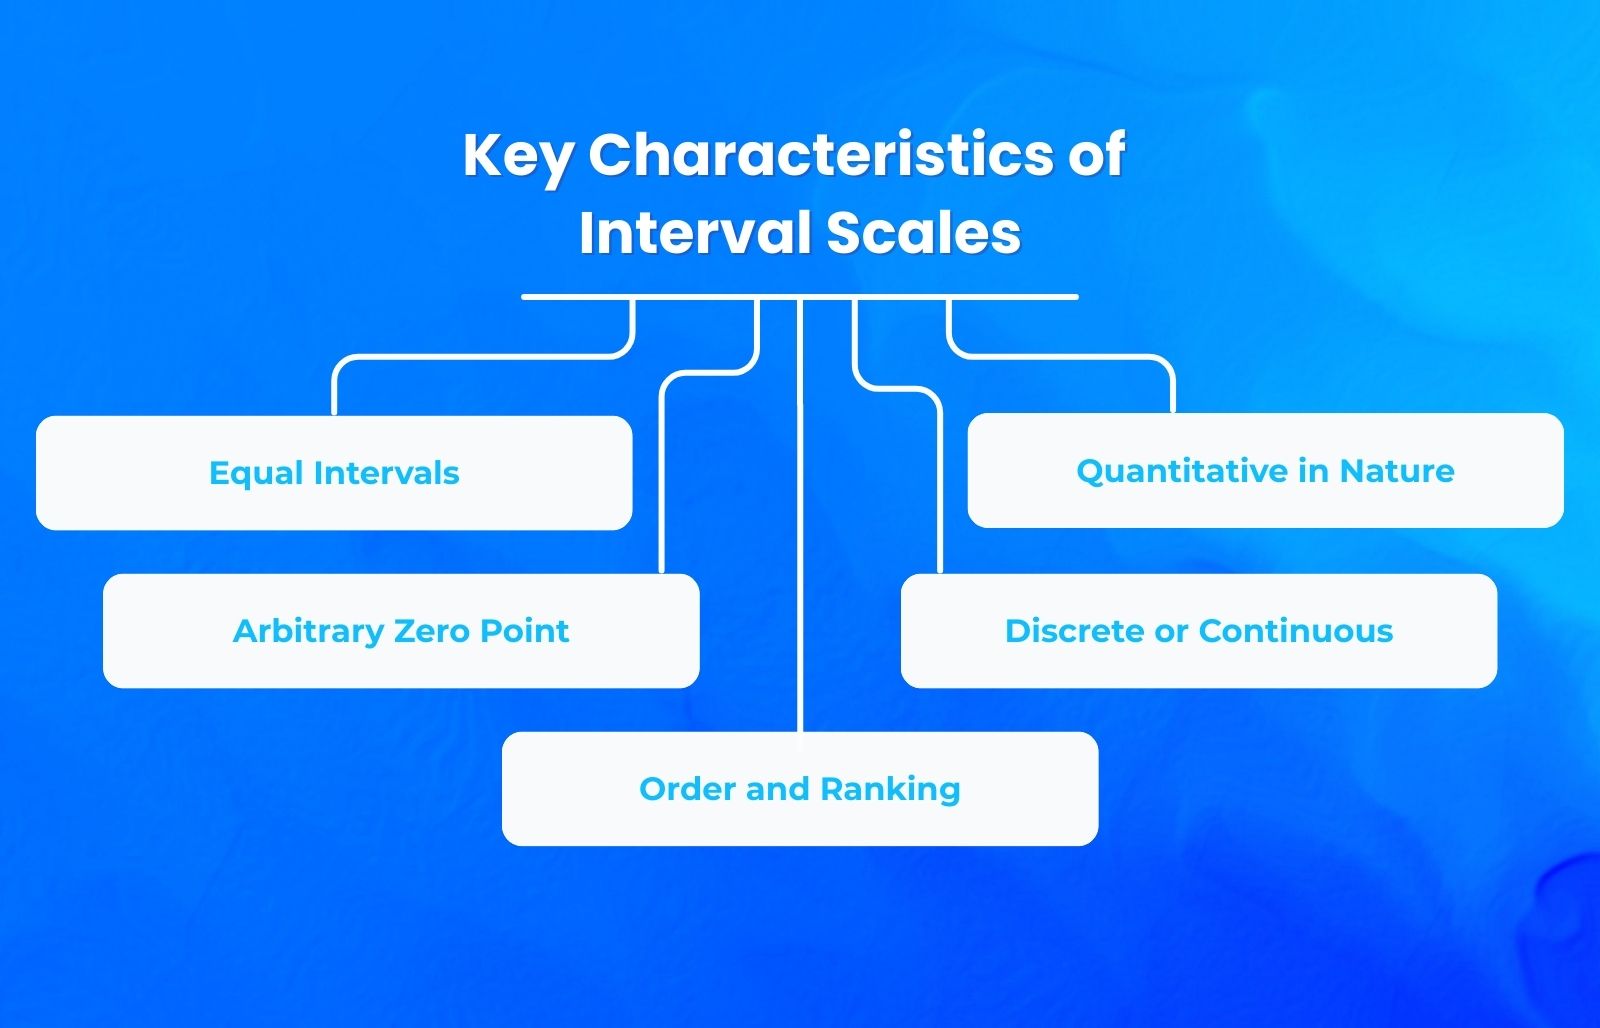
Equal intervals
The distances between consecutive points on an interval scale are always equal and consistent. If you're measuring satisfaction on a 1 to 5 scale, the gap between satisfied (4) and very satisfied (5) represents the same amount of change as the gap between neutral (3) and satisfied (4). This uniformity is what allows meaningful mathematical comparisons.
Arbitrary zero point
Interval scales lack a true zero, zero is just another point on the scale, not the absence of the property being measured. A temperature of 0°C doesn't mean no temperature; it's simply where the Celsius scale places its reference point. Because zero is arbitrary, you cannot make ratio statements like 80°F is twice as hot as 40°F, even though the numbers suggest it. Ratio calculations don't work on interval data.
Order and ranking
Values on an interval scale have a logical order. You can always say which value is greater or smaller, unlike nominal scales where categories have no inherent ranking. This ordering, combined with equal intervals, is what enables statistical analysis.
Quantitative in nature
Interval scales are quantitative, not qualitative. They express data as numbers, and those numbers carry mathematical meaning. You can calculate averages, standard deviations, correlations, and other statistical measures, things you simply cannot do with categorical data.
Discrete or continuous
Interval data can be expressed in whole numbers (discrete) or include fractional values (continuous). A survey might ask respondents to rate something 1 to 10 (discrete), while temperature measurements can include decimals like 98.6°F (continuous). Both are interval data.
Common examples of interval scales
Interval scales show up everywhere in research and business. Here are the most practical examples:
Temperature measurements
Temperature in Celsius or Fahrenheit is the classic interval scale example. The difference between 20°C and 30°C is the same as between 30°C and 40°C, 10 degrees either way. Notably, temperature in Kelvin is not an interval scale; it's a ratio scale because 0 Kelvin is an absolute zero, the absence of all thermal energy.
Time and calendar data
Calendar years, time of day, and measured time intervals are all interval scales. The difference between 2020 and 2025 is the same as between 2025 and 2030 (five years). A clock's numerals are equidistant, 3 o'clock to 4 o'clock represents the same 60-minute span as 5 o'clock to 6 o'clock.
Psychological and IQ scores
IQ tests produce interval data. There's no meaningful IQ of zero, you can't have no intelligence, but the difference in cognitive ability between an IQ of 100 and 110 is treated as equivalent to the difference between 110 and 120. IQ scores can be mathematically averaged and compared.
Rating and likert scales
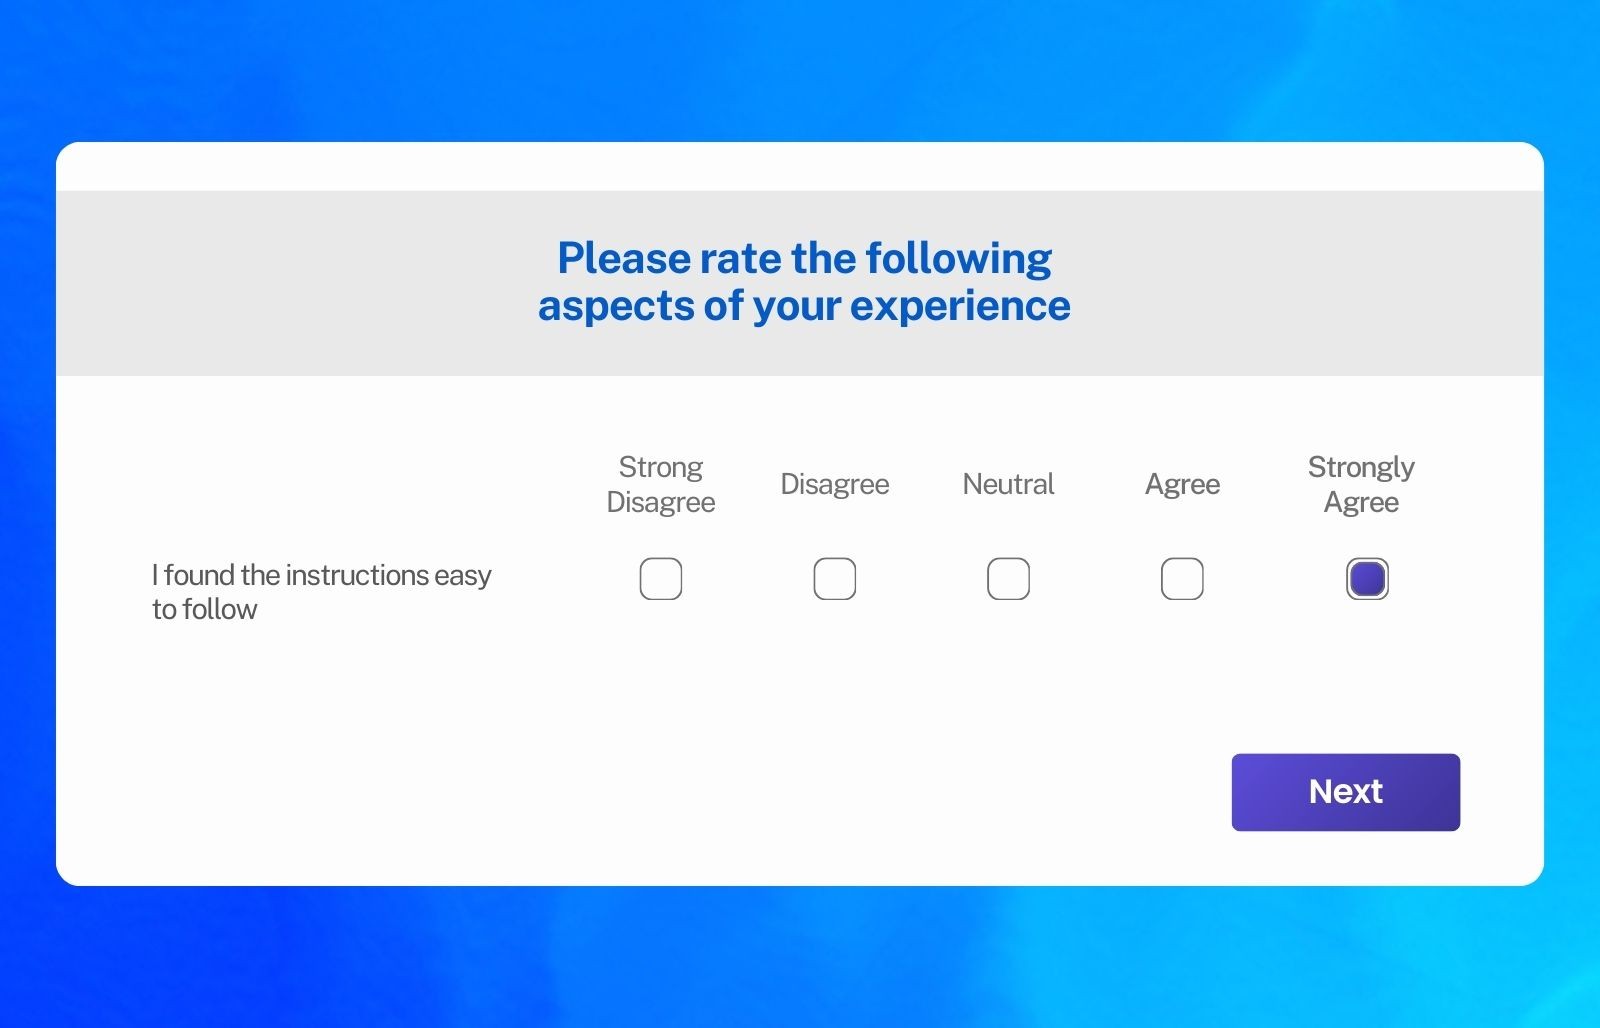
When you ask survey respondents to rate their agreement on a scale like 1 to 5 (Strongly Disagree to Strongly Agree), you're collecting interval data. Each point represents an equal shift in sentiment, and you can calculate the average response across respondents.
Net Promoter Score (NPS)
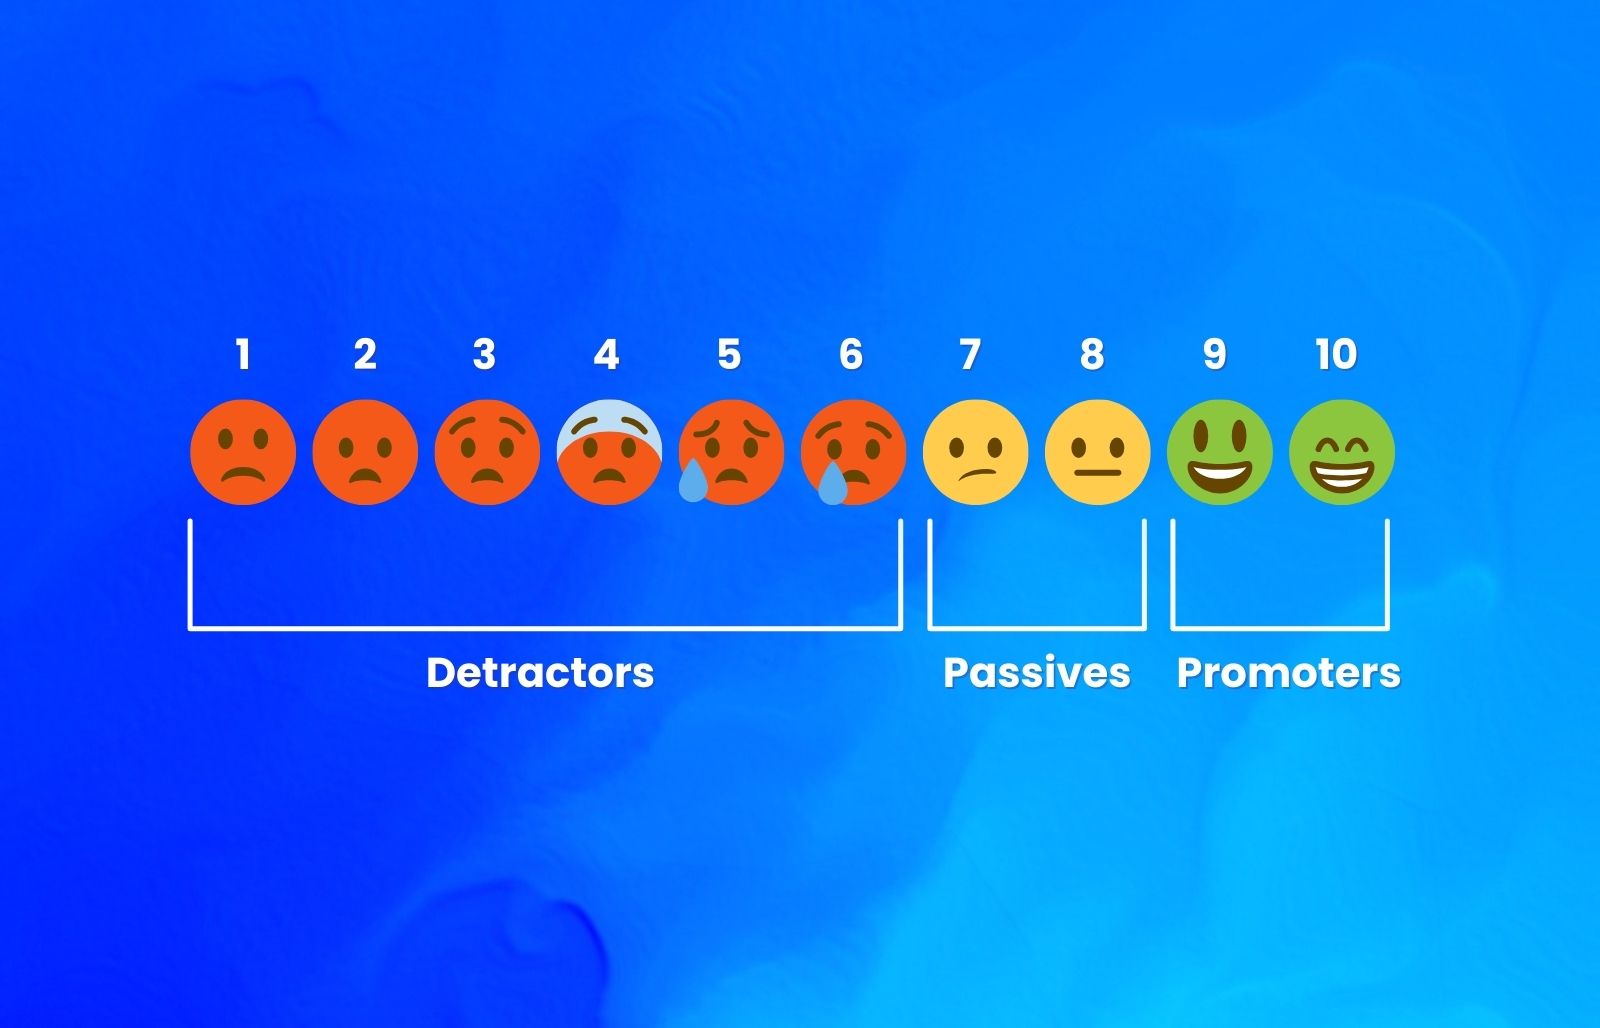
NPS questions ask: How likely are you to recommend us on a scale of 0 to 10? The distances between each point (0 to 1, 1 to 2, etc.) are treated as equal, making this an interval scale. This allows organizations to compute average NPS across customer segments.
Satisfaction and sentiment scales
Customer satisfaction surveys (1-5 or 1-10 scale) collect interval data. The same applies to employee engagement surveys, product feedback scales, or any Likert-based question.
How to identify interval data in your surveys
Not every numbered scale is interval data, and that's an important distinction. Use this checklist to determine if your survey question produces interval scale data:
Are the intervals equal? Can you confidently say the difference between point 2 and 3 equals the difference between point 4 and 5? If yes, it's likely interval.
Does zero have arbitrary meaning? If zero means none or complete absence, it's ratio data, not interval. If zero is just another point on the scale, it's interval.
Can you perform math operations? Can you add, subtract, and average the responses? Interval scales allow this. Nominal or ordinal scales don't.
Are responses naturally ordered? Nominal data like gender or color has no order. Ordinal data like rank or preference has order but unequal spacing. Interval data has both order and equal spacing.
Is the data quantitative? Interval scales express numerical information, not categories. If your answer choices are words or categories without clear numerical meaning, it's not interval data.
Best practices for using interval scales
Once you've confirmed you're working with interval data, follow these practices to get reliable results:
Use consistent scaling
All interval scales in a single survey should have the same range and spacing. A mix of 1 to 5 and 1 to 10 scales in the same questionnaire makes it harder to compare results and analyze patterns. Consistency improves data quality.
Avoid extreme scale ranges
While technically valid, scales that are too large like 1-100, often confuse respondents and reduce accuracy. Most research supports 5-7 point scales as optimal for survey response quality and statistical reliability.
Center the scale when possible
For sentiment or agreement questions, center scales around a neutral midpoint. Example: 1-5 with 3 as neutral. This reduces bias and better captures the true distribution of responses.
Label all points clearly
Don't rely on numbers alone. Pair each point with a descriptive label, Strongly Disagree, Disagree, Neutral, Agree, Strongly Agree, to ensure respondents interpret the scale the same way you intend.
Calculate meaningful averages
One of interval scales' biggest advantages is the ability to calculate means and medians. Use this to your benefit, compute average satisfaction scores, track NPS trends, or measure shifts in sentiment over time.
Account for non-responses properly
If some respondents skip a question, exclude those responses from calculations rather than guessing or filling in values. This maintains data integrity.
Frequently asked questions
What's the difference between an interval scale and a ratio scale?
The main difference lies in the zero point. Interval scales have an arbitrary zero (zero doesn't mean absence), while ratio scales have a true zero. This matters mathematically: on a ratio scale, you can say Product A costs twice as much as Product B, but on an interval scale, you cannot say 80°F is twice as hot as 40°F" because zero is arbitrary. Ratio scales allow all mathematical operations; interval scales allow only addition, subtraction, and averaging.
Is a likert scale an interval scale?
Yes, likert scales (1-5, 1-7, etc.) produce interval data. Each point on the scale represents an equal increment in agreement or sentiment. However, this assumes respondents perceive the distances between points as equal, which is why clear labeling matters.
How do I know if my survey data is interval?
Use this quick test: Can you add, subtract, and average the responses meaningfully? Do the answer options represent equal steps? Is zero arbitrary? If you answered yes to all three, you have interval data. If the spacing is unequal or zero means absence, you likely have ordinal or ratio data instead.


