Survey Rating Scales: Types, Examples, and Best Practices
Published Date: Mar 5, 2026

Key Takeaways
Understand what survey rating scales measure - They help capture opinions, satisfaction levels, attitudes, and perceptions in a structured format that can be analyzed and compared.
Choose the right rating scale type - Different formats such as Likert scales, numeric scales, and semantic differential scales are suited to different survey goals and question types.
Keep rating scales simple for respondents - Shorter scales such as five-point ratings usually make surveys easier to answer while still providing meaningful variation in responses.
Maintain consistency in scale design - Clear labels and a consistent scale direction across questions reduce confusion and improve response accuracy.
Test rating scale questions before launching a survey - Running a small pilot helps identify unclear wording, confusing scales, or response patterns that could affect data quality.
Survey rating scales are standardized response options used in a survey to measure opinions, attitudes, satisfaction, or perceptions in a consistent and quantifiable way. A well-designed survey response scale helps transform subjective feedback into structured data that can be analyzed, compared, and tracked over time.
Because rating scales are central to survey research, choosing the right scale type is critical for accuracy, clarity, and data quality.
What is a survey rating scale?
A survey rating scale is a type of survey question that asks a respondent to evaluate something along a defined range of values. These values may be numeric, verbal, visual, or adjective-based, depending on the type of survey scale used.
Rating scale questions are commonly included in questionnaires because they allow respondents to select a position on a scale rather than provide open-ended answers. This structure makes responses easier to aggregate, compare, and interpret across a dataset.
Why rating scales are used in surveys
Rating scales are widely used because they provide consistent, comparable data across respondents.
They are especially effective for measuring customer experience, usability, satisfaction, agreement, and likelihood. Compared to open-ended questions, rating scales reduce respondent effort and improve completion rates in online surveys.
According to research summarized by the Pew Research Center, clearly structured response scales improve response consistency and reduce interpretation errors in survey design.
Common types of survey rating scales
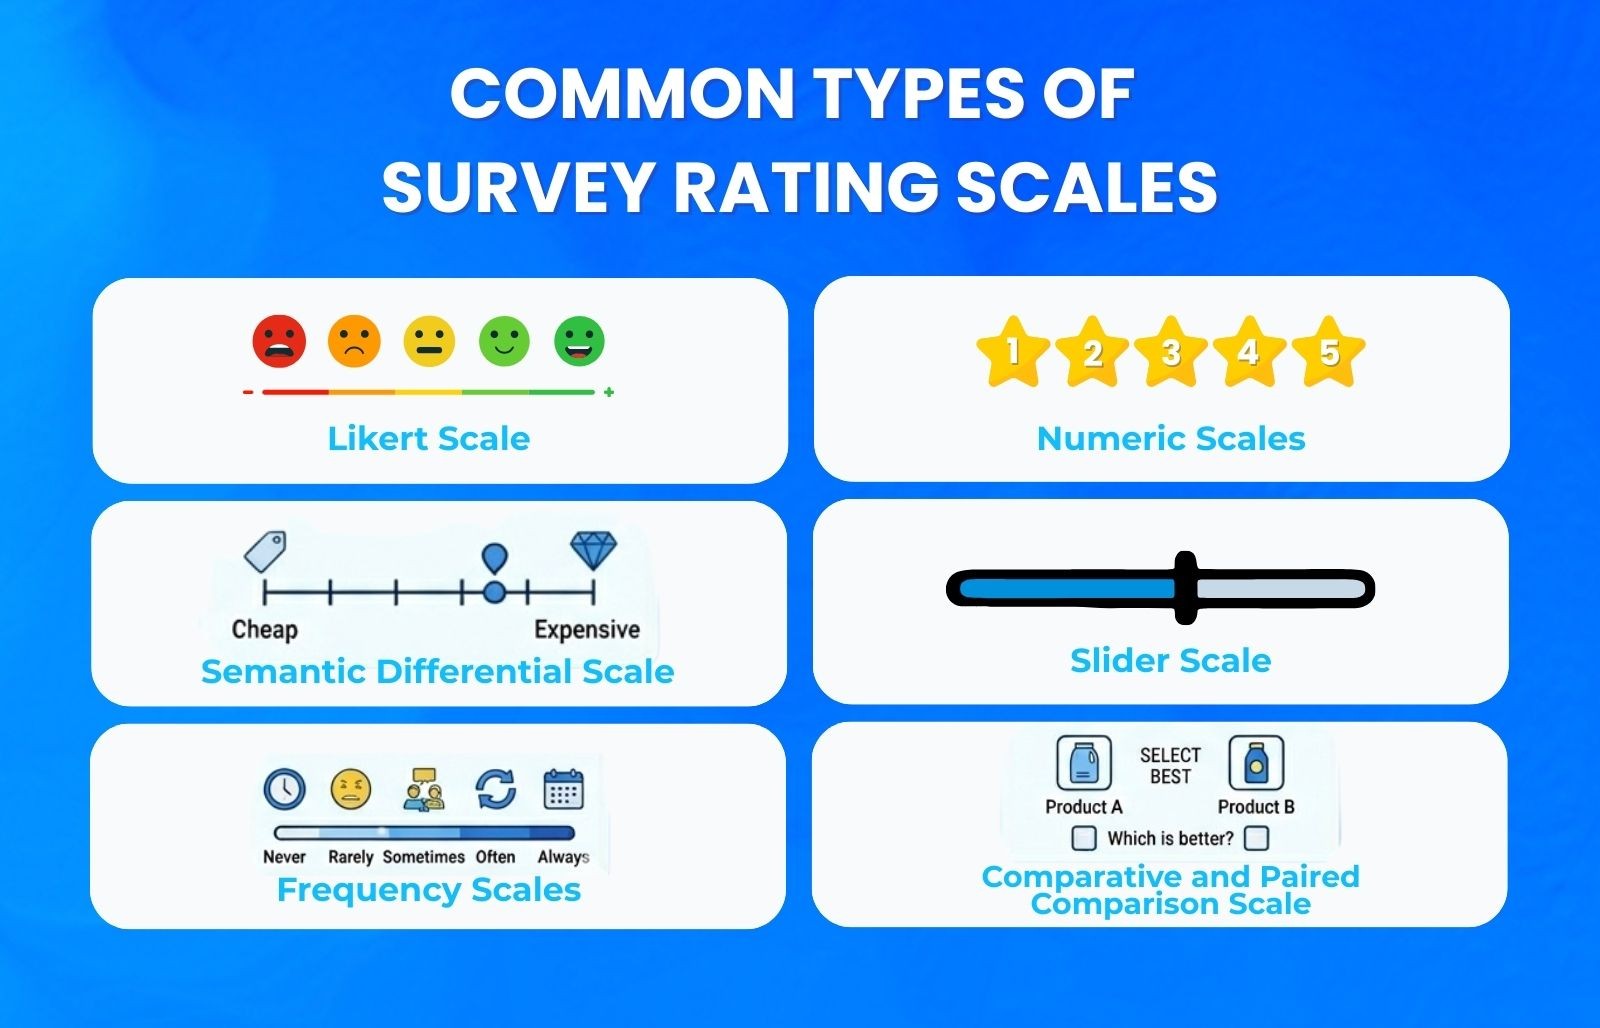
Different survey goals require different types of rating scales. Choosing the right scale helps ensure responses are clear, meaningful, and easy to analyze. Below are some of the most commonly used survey scale types and when they are typically used.
Likert scale
A Likert scale measures how strongly respondents agree or disagree with a statement. It is one of the most widely used formats for measuring attitudes, beliefs, and perceptions. Respondents usually select an option ranging from strongly disagree to strongly agree. This scale is commonly used in employee engagement surveys, customer feedback surveys, and usability research.
Numeric scales
Numeric scales use numbers only, such as one to five or one to ten, without descriptive labels. Respondents select the number that best represents their rating. These scales are commonly used in quick feedback surveys and data-driven research. They are simple to answer and easy to analyze.
5-point rating scale
A 5-point rating scale asks respondents to rate something using five response options. These may be numeric or descriptive, such as very poor to excellent. This format is often used to measure satisfaction, quality, or performance. It works well for general surveys because it provides useful variation without making the question too complex.
1–10 rating scale
A 1–10 rating scale provides more response options for more detailed evaluations. Respondents rate an experience, product, or service using numbers from one to ten. This scale is commonly used in product reviews and customer experience surveys. It can provide more precise feedback, but it may require slightly more effort from respondents.
Semantic differential scale
A semantic differential scale measures perception using two opposite descriptors at each end of a scale. Respondents choose a point between the two adjectives that best represents their view. For example, a product may be rated between easy to use and difficult to use. This scale is commonly used in brand perception and user experience research.
Slider scale
A slider scale allows respondents to move a marker along a visual line to indicate their response. It is commonly used in online surveys and mobile questionnaires. This format can make surveys feel more interactive and engaging. However, responses may be slightly less precise compared to fixed options.
Comparative and paired comparison scale
Comparative scales ask respondents to evaluate options relative to each other. In a paired comparison, respondents are shown two items and select the one they prefer. This method is useful for identifying clear preferences between products or features. It is often used in product testing and prioritization research.
Frequency scales
Frequency scales measure how often a behavior or activity occurs. Respondents choose options such as never, rarely, sometimes, often, or always. These scales are useful for understanding behavior patterns over time. They are commonly used in behavioral surveys and usage studies.
How to choose the right rating scale for your survey
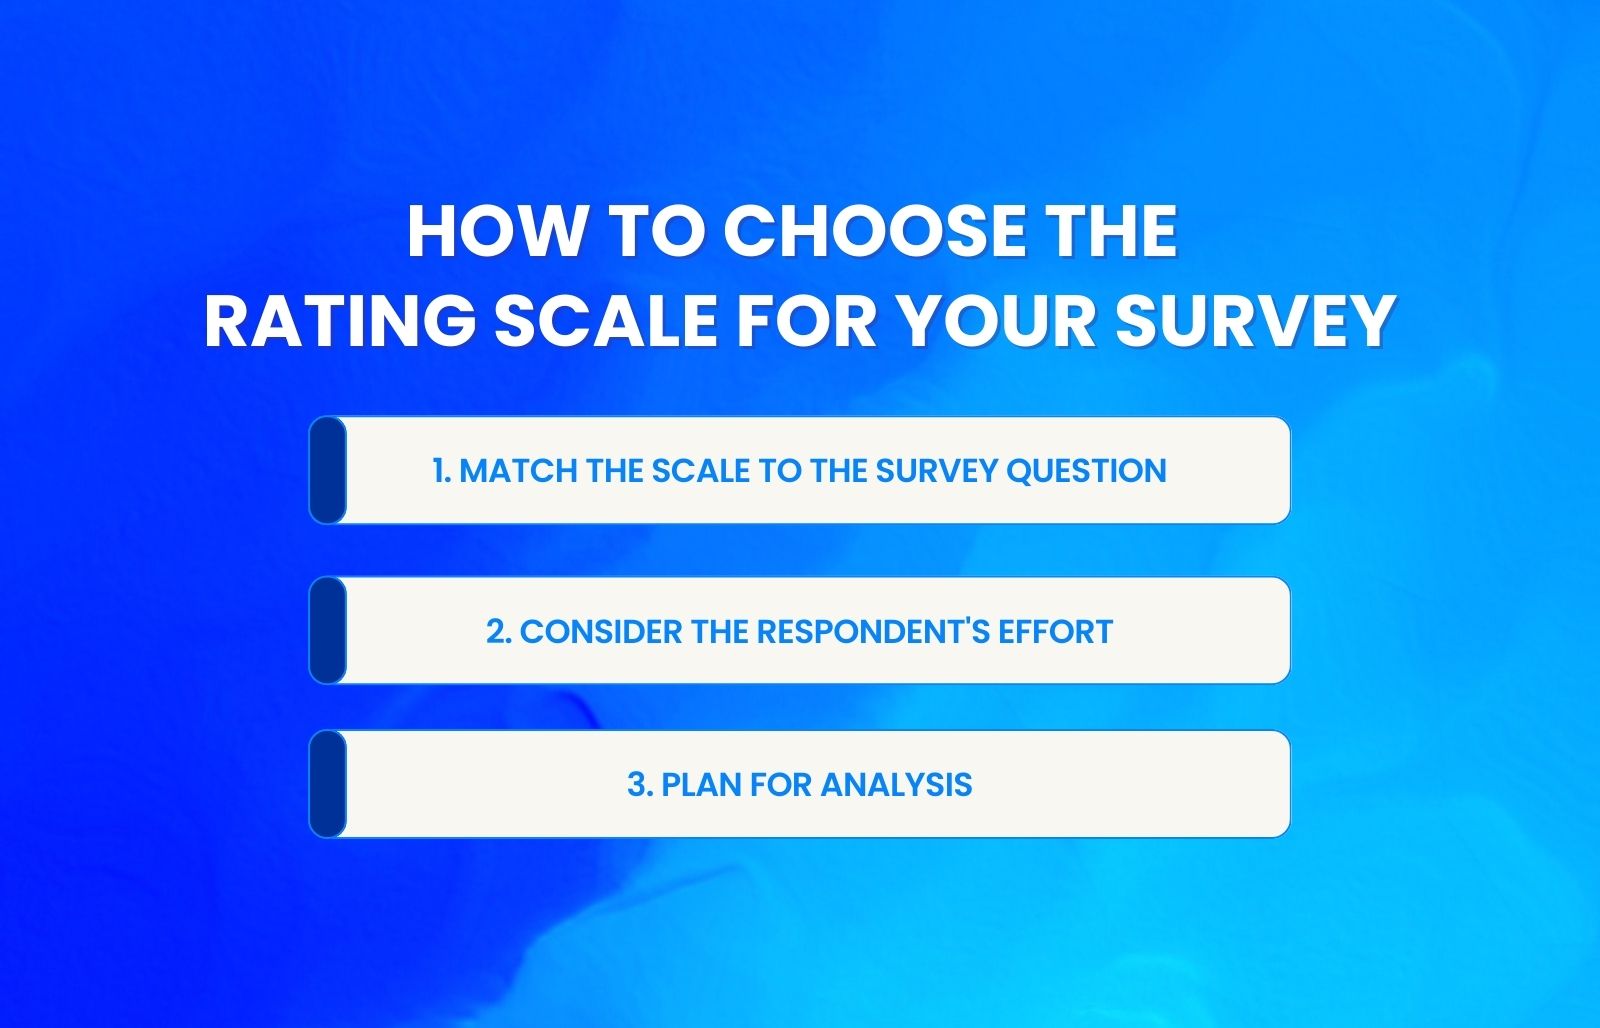
Selecting the right rating scale for your survey depends on your research objective, audience, and analysis approach.
Match the scale to the survey question
If the survey question measures agreement or attitude, a Likert scale is often the best fit. For satisfaction or quality ratings, a 5-point rating scale is usually sufficient.
When measuring perception or meaning, a semantic differential scale provides clearer insight than numeric options alone.
Consider the respondent's effort
Shorter scales reduce cognitive load and improve completion rates. For most surveys, scales with 1 to 5 response options are easier for respondents to answer consistently.
More granular numeric scales are better suited to expert users or highly engaged audiences.
Plan for analysis
Different scale types produce different kinds of data. Likert scale responses are ordinal, meaning they reflect order but not precise distance between points. Numeric rating scales are also technically ordinal, but they are commonly analyzed using parametric methods when assumptions are met, and scale design supports it.
Your analysis approach should influence the type of survey scale you choose, especially if results will be compared over time or used for statistical testing.
Best practices for rating scale questions

Following rating scale best practices improves data quality and reduces bias.
Use clear and consistent labels
Each point on the scale should be clearly defined, especially the endpoints. Ambiguous labels increase interpretation errors.
Keep scale direction consistent
Always present scales in the same order throughout the survey. Changing direction mid-survey can confuse respondents and affect data accuracy.
Avoid too many scale points
Adding more points to a rating scale does not automatically lead to better data. For most general audiences, scales with more than seven options tend to add complexity without meaningfully improving response reliability.
Test your survey scale
Testing rating scale questions with a small sample helps identify unclear wording, confusing scale questions, or unintended response patterns before launch.
Use rating scales for better feedback
Rating scales are a foundational element of effective survey design because they provide a consistent way to measure opinions, behaviors, and experiences. When the appropriate survey scale is selected and applied with clear best practices, the resulting data becomes easier to interpret, compare, and act on.
In modern survey and form-building environments like Formflow, we use rating scales thoughtfully to support clearer question design and more reliable feedback collection.
By using a consistent response format, rating scales help surveys measure the intended topic more clearly and minimize ambiguity in the results.
Frequently asked questions
How do you choose the best rating scale for a survey question?
The best rating scale depends on what the question is measuring and how the results will be analyzed. Agreement and attitude questions typically work best with Likert scales, while satisfaction or performance questions often suit 5-point or 1–10 scales. Respondent familiarity and survey length should also guide the decision.
Is a 5-point or 7-point rating scale better for surveys?
A 5-point rating scale is usually better for general audiences because it is easier to understand and answer consistently. A 7-point scale can capture more nuance but may increase cognitive effort. Increasing the number of response options beyond five often provides limited additional benefit for many survey use cases, while making questions slightly harder for respondents to answer consistently.
When should you use a 1–10 rating scale instead of a Likert scale?
A 1–10 rating scale works best when respondents are comfortable making numeric judgments and small differences matter. Likert scales are more effective for agreement-based questions with clear verbal anchors. Using 1–10 scales too frequently can reduce consistency if respondents interpret numbers differently.
What are the most common mistakes when using rating scales?
Common mistakes include unclear scale labels, inconsistent scale direction, and using too many response options. These issues increase confusion and reduce data quality. Another frequent problem is choosing a scale that does not align with the survey question, which weakens the accuracy of the results.
Should rating scales include a neutral option?
Including a neutral option is useful when respondents may genuinely feel undecided or indifferent. Removing it can force opinions that do not reflect true attitudes. Whether to include a midpoint should depend on whether the goal is accurate measurement or encouraging respondents to choose a side.
How many points should a rating scale have for reliable results?
Most surveys achieve reliable results with rating scales that have five to seven points. Fewer points can oversimplify responses, while more than seven rarely improves accuracy. For broad audiences, five-point scales typically provide the best balance between clarity and analytical usefulness.
Are slider scales as accurate as numeric rating scales?
Slider scales are engaging but generally less precise than numeric rating scales. Respondents may place sliders imprecisely, especially on mobile devices. Slider scales are best used when approximate values are acceptable and visual interaction is more important than exact measurement.
How do rating scales improve data analysis?
Rating scales improve data analysis by standardizing how responses are captured across respondents. This consistency makes it easier to compare results, track trends over time, and apply statistical methods. Well-designed scales reduce noise and increase confidence in survey insights.


